Process Data Historian Software
Collect Data, Easily Analyze, & Get Value
INS3 – Industrial Network Systems offers affordable software that simplifies Storing and Analyzing Time-Series Data. We support multiple historians and are experts at architecting and implementing your process data collection and analysis. We also specialize in converting process historian data and applications.
Most companies realize the need to collect, store and analyze process data to improve productivity, quality, and overall efficiency. The key is to find an affordable solution that gives you open access to your data. INS3’s software offering is a great way to get there.
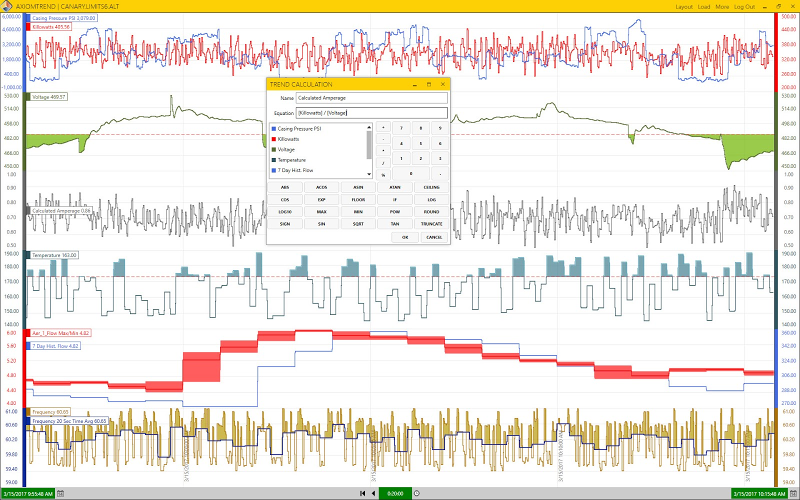
Meet Canary, A Time-Series Database built for Industrial Automation
What Are Your Data Barriers?
Professionals real-time and historical access to sensor and machine data. Overly complex databases and IT roadblocks can get in the way. You need a simple, yet powerful, process data solution so you can succeed.
At INS3, we see three major barriers that companies face when trying to put value on the process data they have collected.

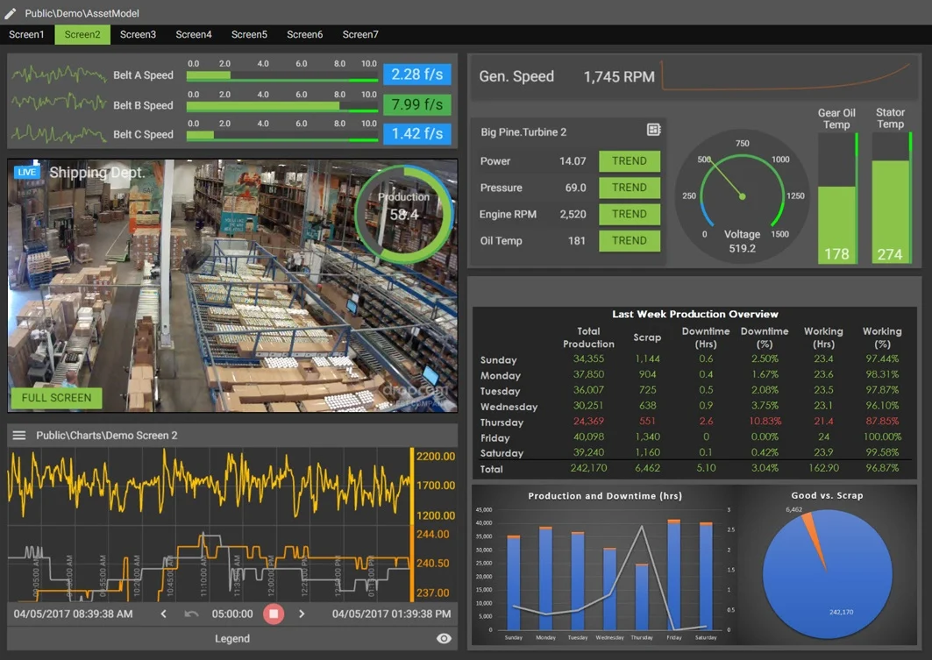
INS3 & Canary Labs break down these barriers
The Canary Solution provides tools that offer an easy-to-use solution to collect, store, and analyze large amounts of process data!
Collection, Storage and Analytics Features
- The store and forward feature automatically caches data to remove risk of data loss as well as sending notifications if the Historian does not receive the data.
- Canary’s solution allows users to run SQL queries.
- Additional data connectivity such as .Net or Web API, HDA Server and an ODBC connector is also available.
- Need redundancy? Mirrored data is also available!
From a single site to hundreds of facilities, Canary makes using your process data easy.
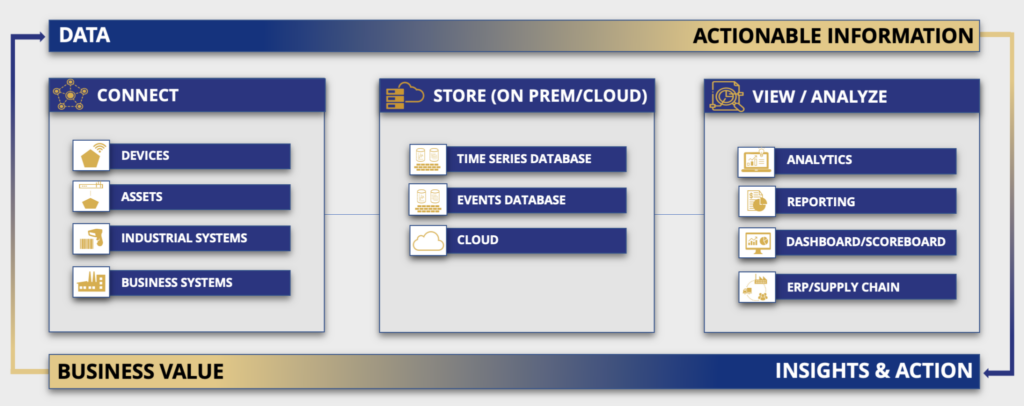
There are three parts to how Canary’s system works...
The Canary Solution provides tools that offer an easy-to-use solution to collect, store, and analyze large amounts of process data!
Collect & Store Your Data
Collect data from all or some of your devices and store it with loss-less compression.
Assign Context to Your Data
Transform your complex data into easy-to-understand information.
Maximize Your Operation
Analyze your operational health on any device and make better decisions.
Canary Labs Data Analytics
Asset Models
Asset Models are created by the user to define templates that contain groups of individual data points or tags. This is very important to reduce the amount of work for larger Enterprise systems. As new tags and assets can be automatically identified as they come online and be grouped into the correct Asset Model.
Events
The events tool monitors previously defined assets. These assets can be monitored and tracked for unusual activity during the complete process and measured against defined limits. The events are then logged in the Canary Database for future analytics. These events can also be configured as Alarms to prompt a notification via text, email or an actual phone call if a value is not within its defined limits.
Axiom
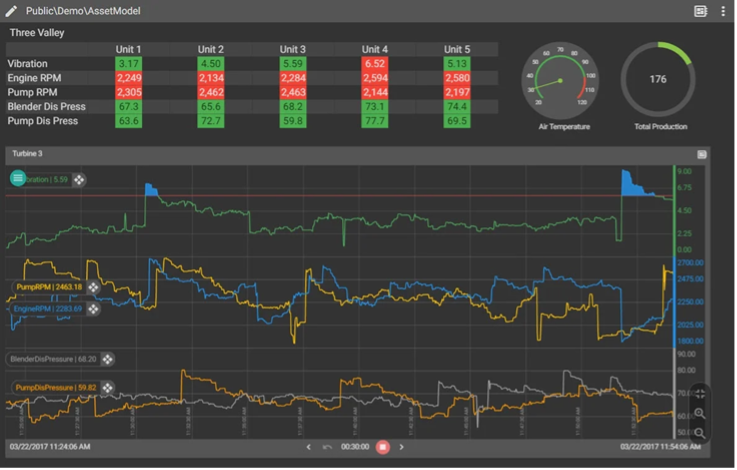
The HTML visualization piece to bring all your Event, Asset, and Tag data to a powerful and easy to use viewable platform. Axiom offers many tools for visualization such as Trending Charts, Tables, Guages, Iframes, C# scripting, Full multi-screen HMI’s can be created with very little training. Dashboard comparison across multiple Asset Models is also incorporated within Axiom.
Excel Add-In
The ability to export Chart CSV data directly from Axiom is an available feature but Canary has also included a very powerful Excel Add-in tool. This Add-in tool allows direct access to data in the Historian. Tag names, tag data, aggregate data as well as events or recorded anomalies are available to access with commonly know software such as Excel.
Ready to scale up your production?
